Understanding the Basics of CPK Charts

Understanding the Basics of CPK Charts

Cpk is a process capability index, a statistical tool used to measure if a process can produce an output that is within the specification limits of the customer. That is, it is used to measure how capable a producer is in producing a product with a customer’s tolerance range. It is used to estimate how close a person is to a set target and also how consistent they are around an average performance. It gives a best-case scenario and can also be used to estimate how an operation will perform in the future with the assumption that the performance will be consistent over time.
You will usually find this tool employed in the manufacturing industry. You can read more about process capability indexes here.
The higher the value, the better the expected result. Generally, a value that is equal to or greater than 1.33 (Cpk = or > 1.33) shows that the process can meet specification limits. A lower value may mean that variation is wide when compared to what the desired specification is or that the average is off from the expected target.
Calculating CPK
Cpk equals the lowest value of capability versus the upper or lower specification that shows where in the specification limits the process is producing. It is calculated by comparing the average of the data to the limits of specification. To get Cpk, there is a need to calculate a Z score for both the lower (CPL) and upper (CPU) specification limits which are referred to as Z LSL and Z USL respectively.
Since the goal is to measure how many standard deviations will fit between the specification limit and center of the process, the value of these parameters must be components in calculating Z score.
CPL = (process mean – LSL) / 3* Standard deviation)
CPU = (USL – process mean) / 3* Standard deviation)
Therefore as a minimum or the smallest value of the CPL and CPU
Cpk = Min (Cpl, Cpu)
What Values Show a Good CPK?

A negative value or a number that is less than 1 means that you have a lot of variations, are not in complete control and your process is all over the place. These are all things that will not make your customer happy. A value of 1 means you are borderline and can go either way. This is not very convincing. A value of 1.33 and higher means that there is little variation and that the process well controlled.
The reason your customer wants to know your Cpk is to know the probability of getting their production done based on certain specifications. As shown above, if it is less than one, it tells the customer to get some other business to help them. If it is one, the customer will still not be convinced because if there is no room for maneuver, then a slight shift in operation may result in you not meeting up with their specifications.
Most customers want to see that your Cpk is greater than 1 and require that it reaches around 1.33 which is referred to as “in control and capable�. This will give them the confidence that you can deliver within their specifications. It should be noted though that it is not all about being able to meet up with specification as a quality product may include minimal variations that are centered around the targets of the customer. To measure this, a value called Cpm is used.
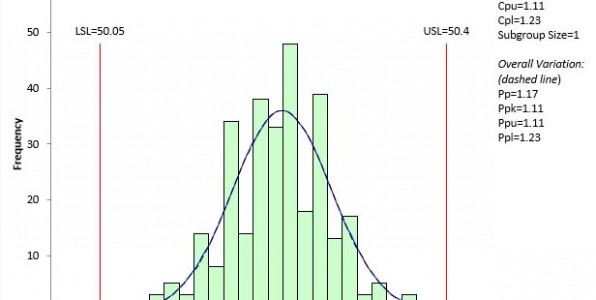
Cpk is most times displayed on a histogram which contains other descriptive statistics. When a customer requires a Cpk chart, endeavor to ask for clarification as they may be referring to different charts or want to see your capability summary involving performance and capability statistics.
Applying Cpk
For unstable processes, the performance analysis is unreliable therefore the value should not be relied upon. Conditions that should be met for it to be relied upon include the following:
- The sample size should be large enough.
- Data used should undergo a normality test.
- The process must be under statistical control.
You can learn more about all these and more here: https://www.pqsystems.com/qualityadvisor/DataAnalysisTools/capability_cpk_when_not_in_control.php
Conclusion
A Cpk chart shows and helps you understand where you stand in relation to certain parameters and specifications of production. If you desire to calculate yours to ensure improvement, there are various easy to use statistical process control (SPC) software that you can use to produce histograms as well as other performance and analysis charts.
Comments are closed